Cumulative Flow Diagram
Is one of the key diagrams to help you manage the work better. A question that we are asked frequently and need to answer is
When can we deliver?
The question that we should ask ourselves and we don’t is
When should we start the work?
A Cumulative Flow Diagram will enable you to answer, “When should we start the work?” Create a spreadsheet as follows
Here’s how you can create a CFD with a spreadsheet.
1- Create a spreadsheet as follows
| Period | Delivered |
| 1 | 1 |
| 2 | 0 |
| 3 | 0 |
| 4 | 2 |
| 5 | 1 |
| 6 | 0 |
| 7 | 1 |
| 8 | 1 |
Delivered is the count of the work items we have delivered, for a given work item type.The period is the time period which we want to measure our delivery rate, for example, an hour, a day, a week, a month.
2- Now add another column, to capture the cumulative delivery of the work items.
| Delivered – cumulative |
| 1 |
| 1 |
| 1 |
| 3 |
| 4 |
| 4 |
| 5 |
| 6 |
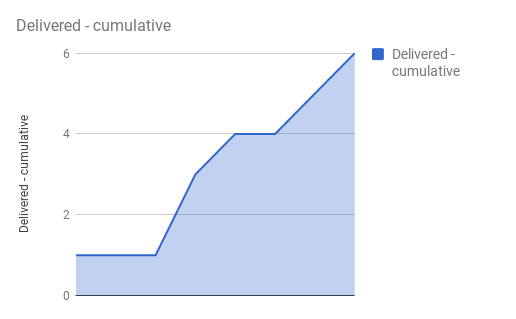
3- Plot this chart over the above period, like this
This graph looks good but there is not enough information in here for us to answer when shall we start the next work item?
We need to add the rate at which we are starting.
4- Add Started columns as below
| Delivered – cumulative |
| 1 |
| 1 |
| 1 |
| 3 |
| 4 |
| 4 |
| 5 |
| 6 |
5- Add the cumulative Started column
| Started – cumulative |
| 2 |
| 3 |
| 5 |
| 6 |
| 9 |
| 10 |
| 11 |
| 13 |
Your spreadsheet should look like this
| Period | Delivered | Started | Delivered – cumulative | Started – cumulative |
| 1 | 1 | 2 | 1 | 2 |
| 2 | 0 | 1 | 1 | 3 |
| 3 | 0 | 2 | 1 | 5 |
| 4 | 2 | 1 | 3 | 6 |
| 5 | 1 | 3 | 4 | 9 |
| 6 | 0 | 1 | 4 | 10 |
| 7 | 1 | 1 | 5 | 11 |
| 8 | 1 | 2 | 6 | 13 |
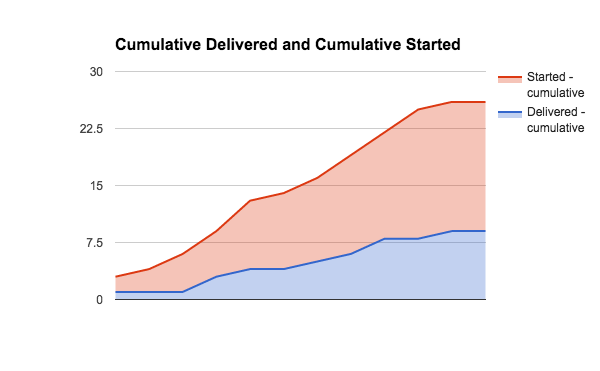
6 – Insert and area chart for the Cumulative Delivered and Started as follows
What can we learn from the chart?
The above Cumulative Flow Diagram (CFD) shows that we are starting more work that we can finish, the number of work items in progress is growing. The time it takes to serve our clients is also growing resulting in more client expedite queries and overburdening of staff, a lose lose situation.
7 – Let’s add another column to measure the Work In Progress (WIP) the difference between the cumulative Started and Delivered. Your spreadsheet will look like this
| Period | Delivered | Started | Delivered – cumulative | Started – cumulative | WIP |
| 1 | 1 | 2 | 1 | 2 | 1 |
| 2 | 0 | 1 | 1 | 3 | 2 |
| 3 | 0 | 2 | 1 | 5 | 4 |
| 4 | 2 | 1 | 3 | 6 | 3 |
| 5 | 1 | 3 | 4 | 9 | 5 |
| 6 | 0 | 1 | 4 | 10 | 6 |
| 7 | 1 | 1 | 5 | 11 | 6 |
When should we start the work?
We can use the WIP column to answer this question, in the above example we can use the WIP of 3 say to decide when to start new work.
CONCLUSION:
We have seen how to use a simple cumulative flow diagram to visualise the start rate and delivery rate and how to use the WIP to decide when to start new work.
Want to learn more about lean and agile ways of working?
Check out our agility training programmes


