This post outlines our workshop format to make the work visible and visualised flow. In this workshop, we use the diverge and converge pattern. That is, we work individually to come up with a diverse set of sources of demand, then collaborate to create the agreed sources.
One of the first steps for managing the work, not the worker, is to visualise the value stream and make the invisible work visible. This post supplements the Kanban Mapping guide and is part of the value stream mapping workshop.
What is in this post is how to visualise your current value flow
- Sources of Demand
- Knowledge discovery steps
- Identify the sources of dissatisfaction
How to map the sources of demand – Material
Post-it notes, multiple colours
Whiteboard
Board marker
Step 1: Set up the whiteboard as shown
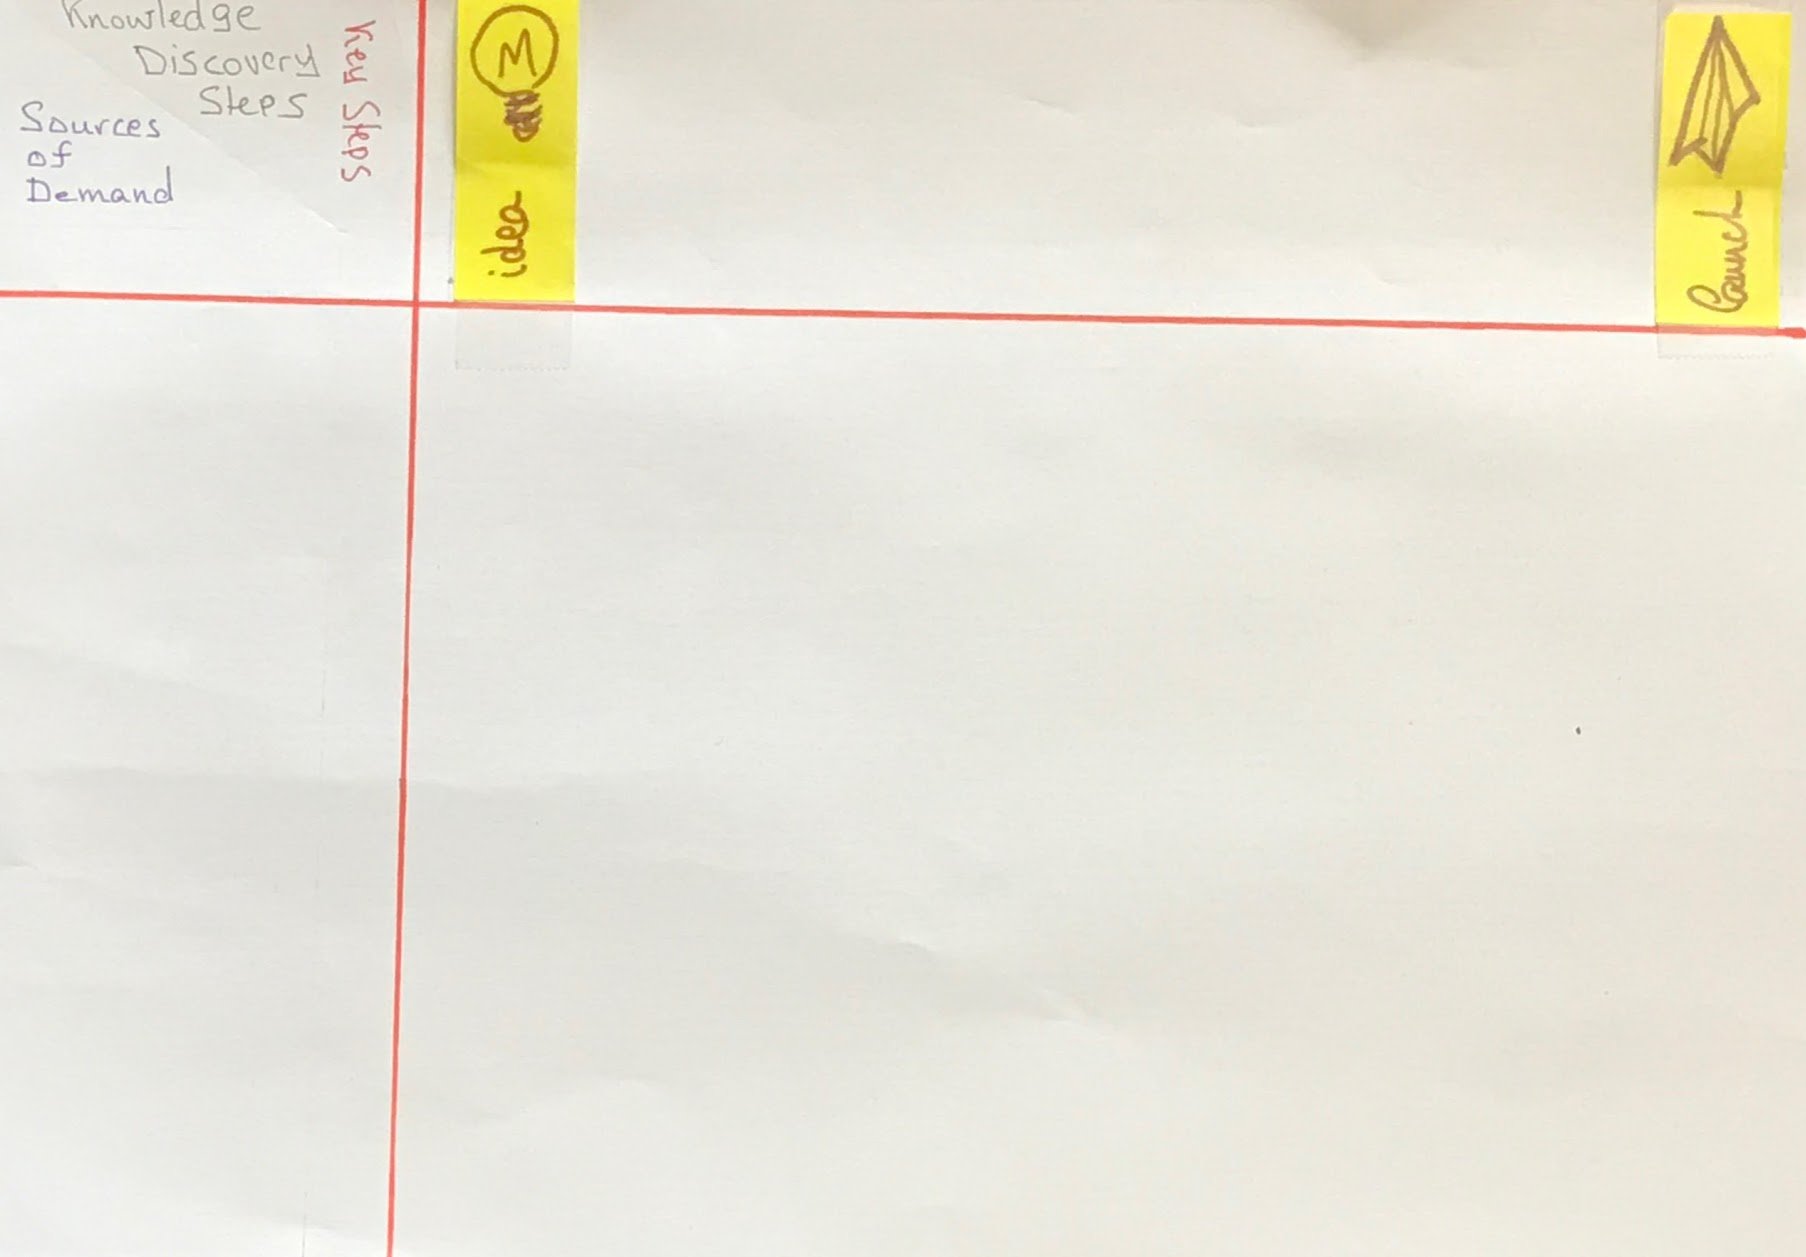
Step 2: List the significant knowledge discovery steps
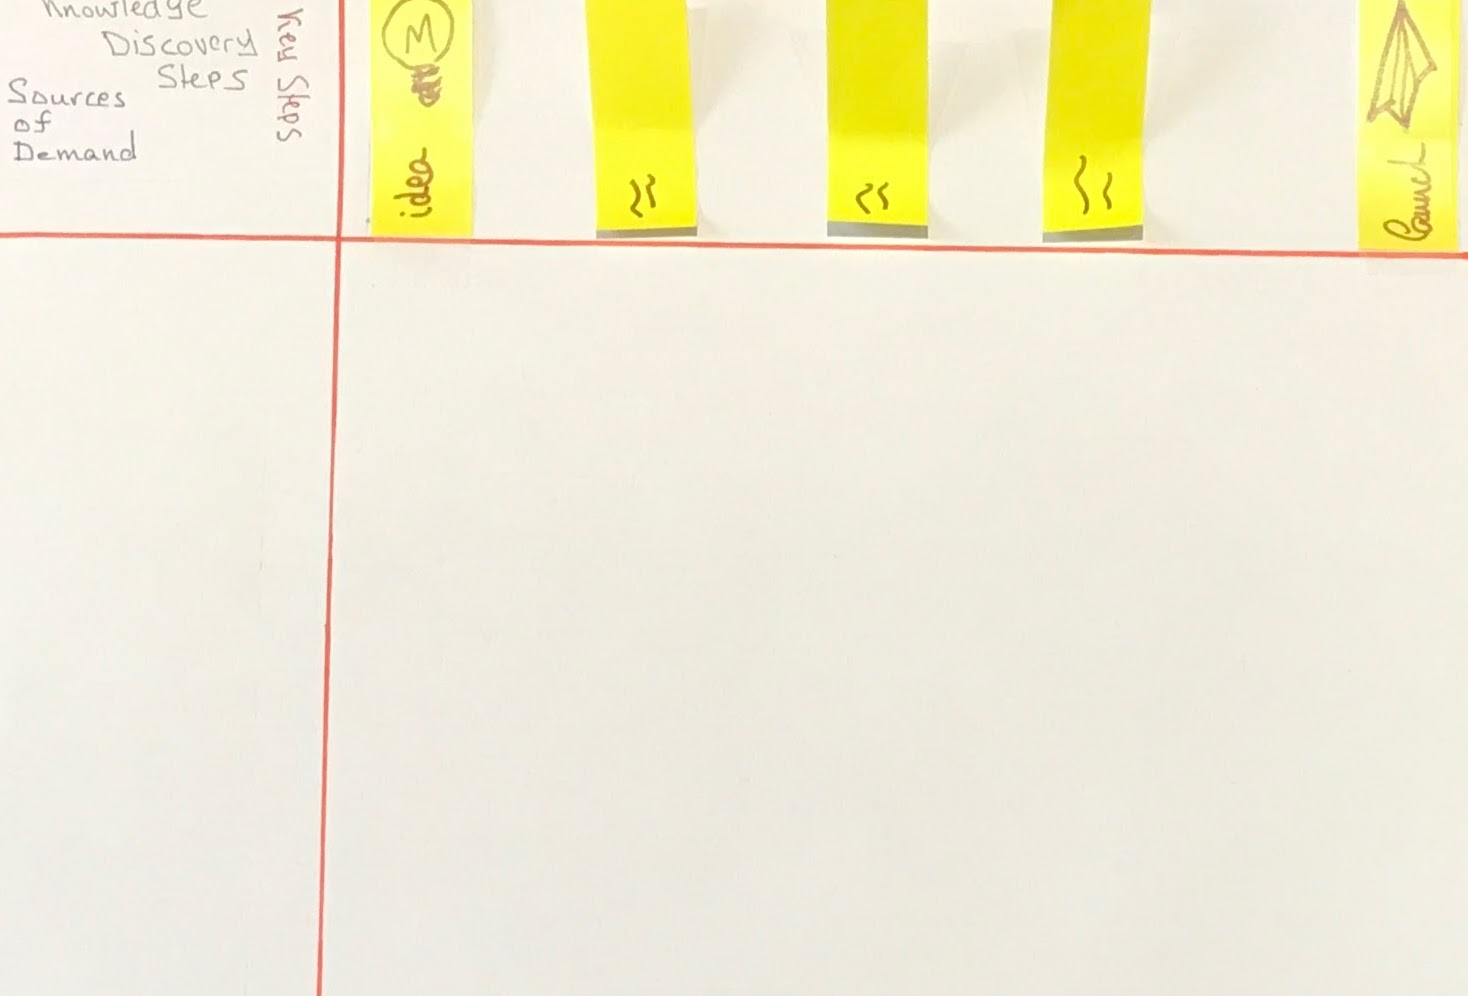
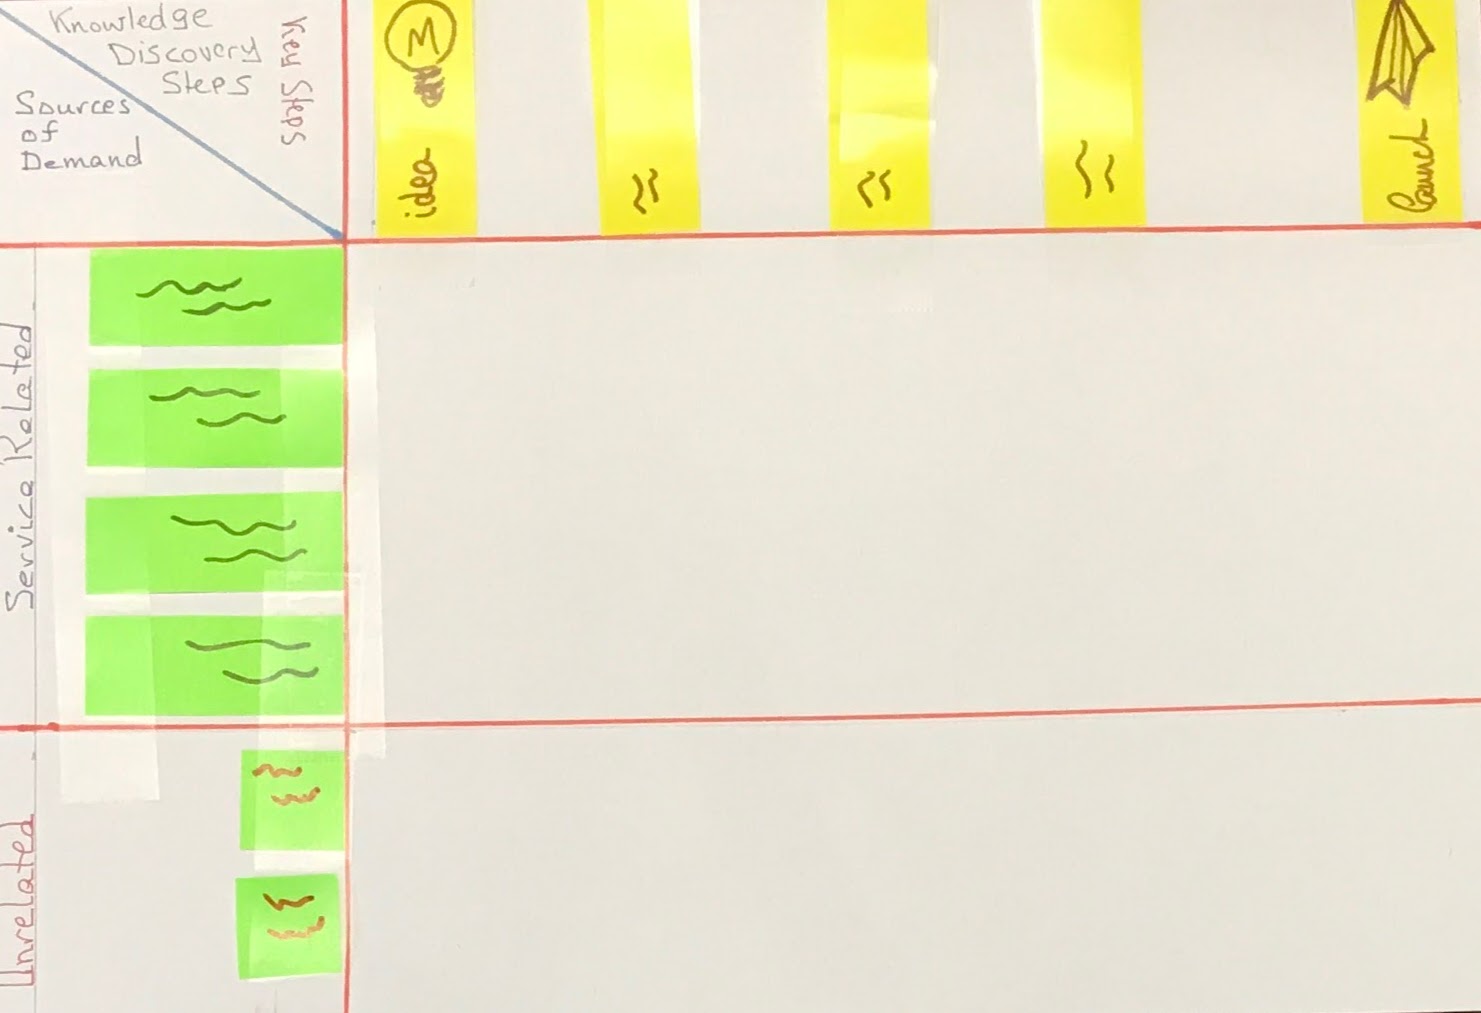
Step 3: Identify the types of demand
Working individually, list the types of demands you get, one type of demand on a post-it.
Could you share your demand types, and remove duplicates?
Group demands that are not for this service and demands that relate to the service,
use a different colour to list the types of demand
Step 4: Run the map
Working
You may discover new demand types!
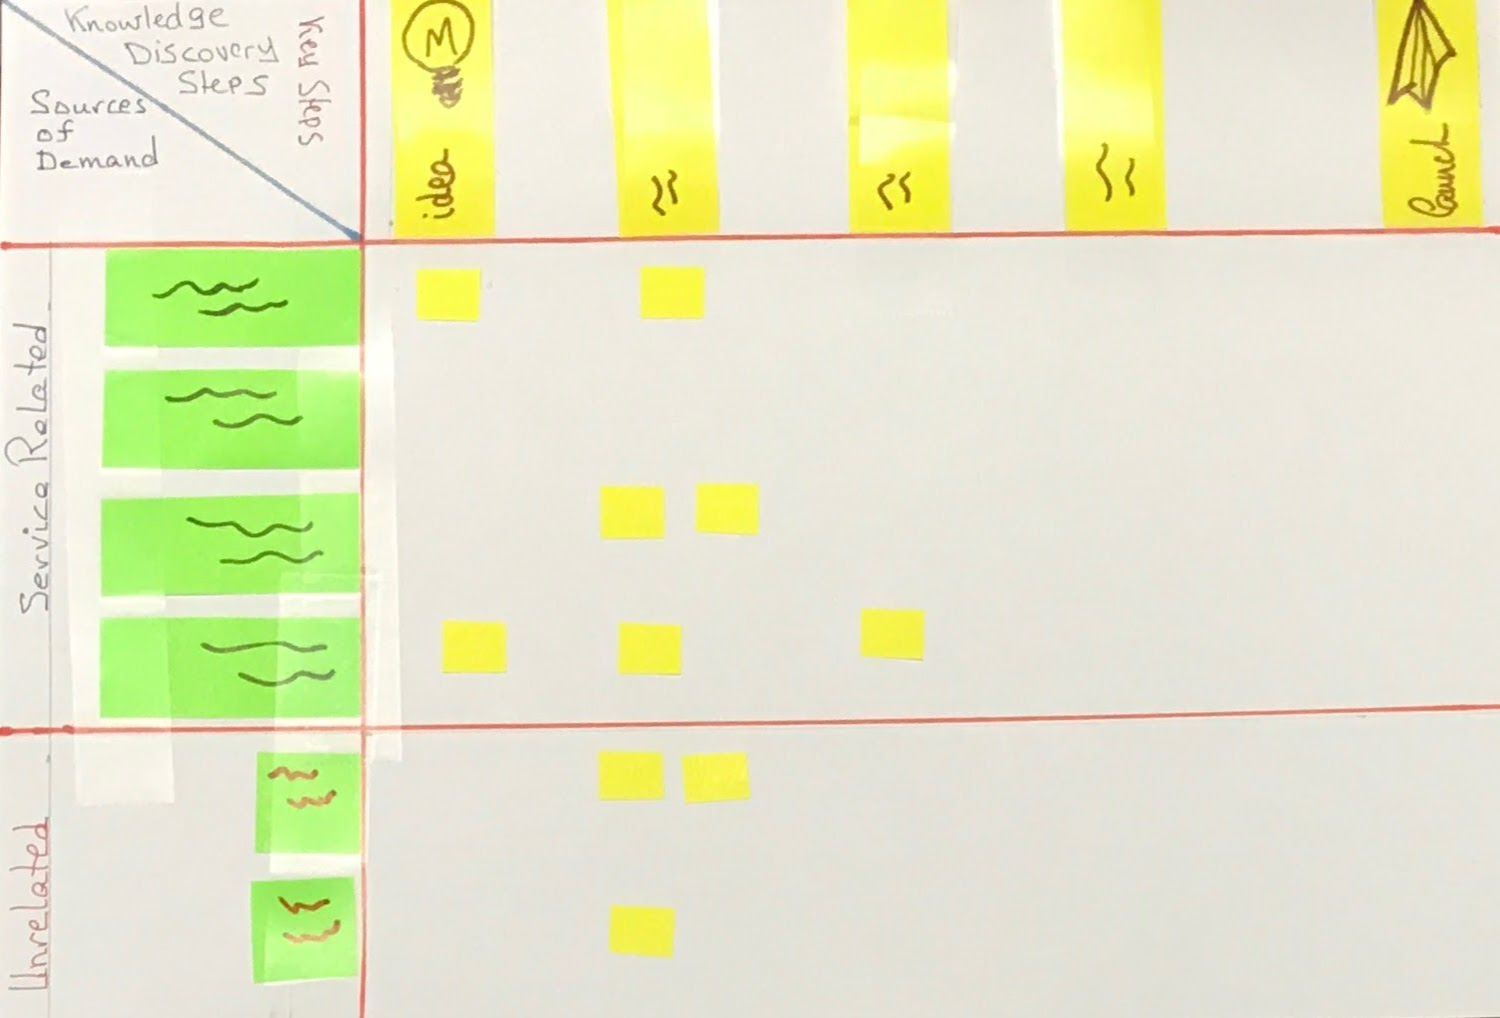
Could you look at how the work is distributed and how many are unrelated to the service? Once you start visualising your work, you can look at the ratio of service-related and unrelated work items for capacity allocation.
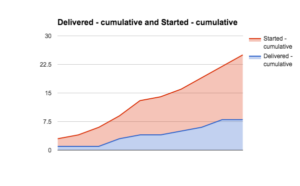
How many are complete?
How many are in progress?
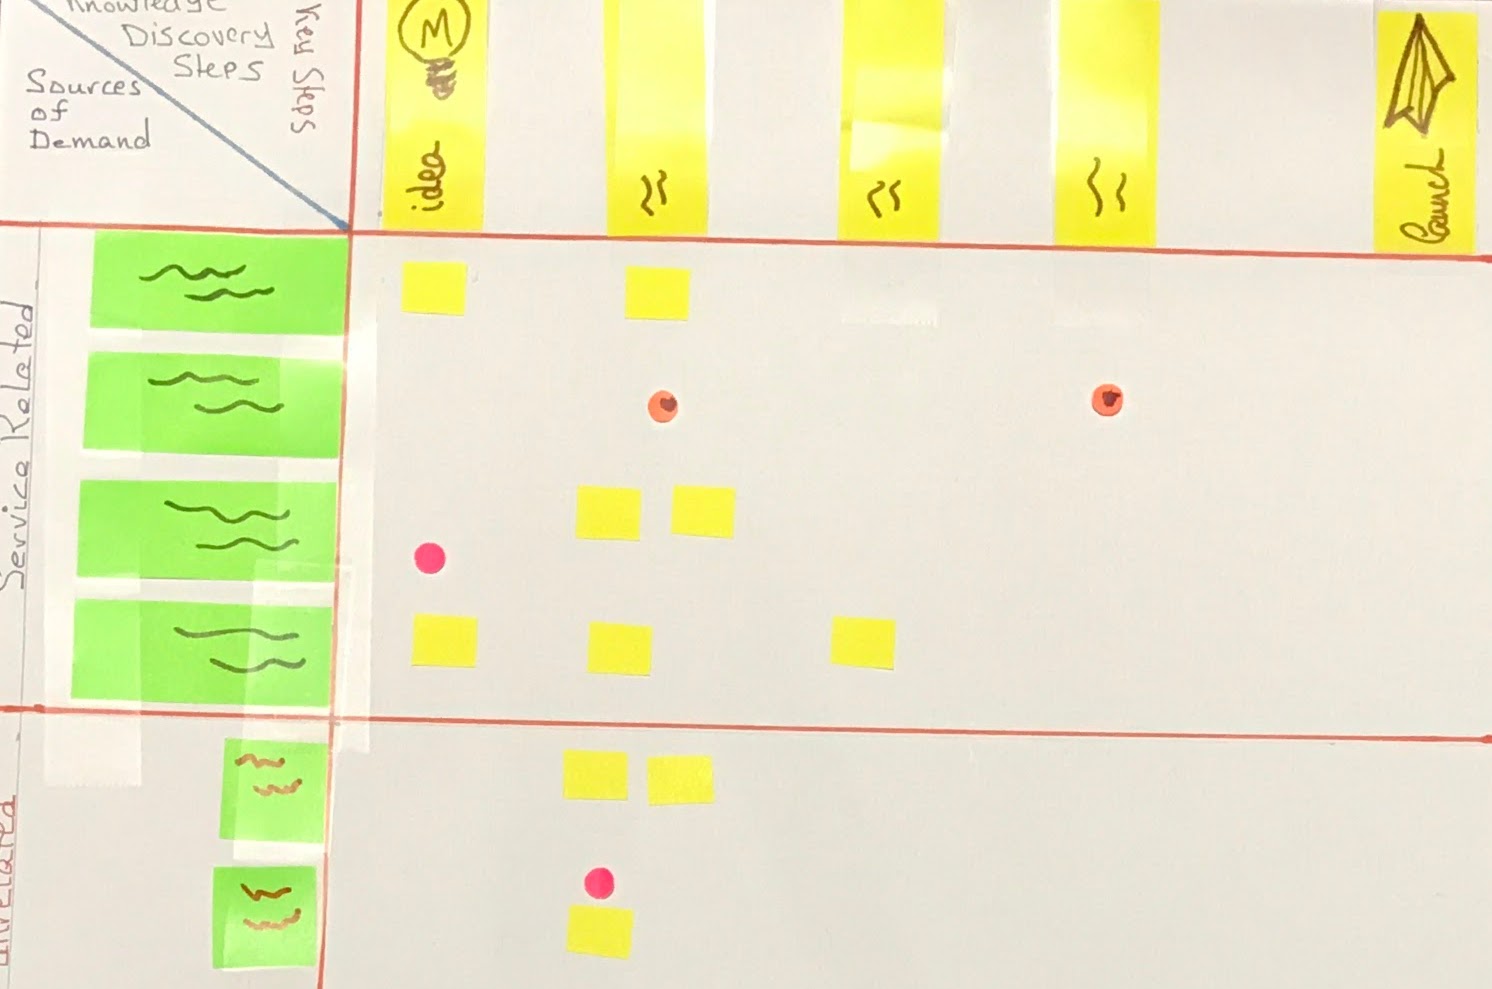
Step 5: Sources of dissatisfaction
Working one work item at a time, individually note the sources of dissatisfaction. Shown as red circles, some with an additional mark to indicate that the source of dissatisfaction is external.
CONCLUSION:
We must make the invisible work visible to see and manage the value flow. In this workshop, we use the diverge and converge pattern and remember mapping the current value flow. Could you identify the sources of demand and work through them one at a time to identify the sources of dissatisfaction?
- Sources of Demand
- Knowledge discovery steps
- Identify the sources of dissatisfaction
Once you have shown your value flow, you can use it to make the work visible and manage the work.
I love to hear your feedback and share how you visualise your value flow.
Want to find out more about visualising work and managing the work, check out.
Related posts
- When should we start?
- What’s slowing you down, and how can you visualise the value flow?
- CASE REPORT: Scrum to Kanban #LonLWS
- Agility Chefs (ACe) – flipping the system and changing the game