FASTER SOFTWARE PRODUCT DELIVERY
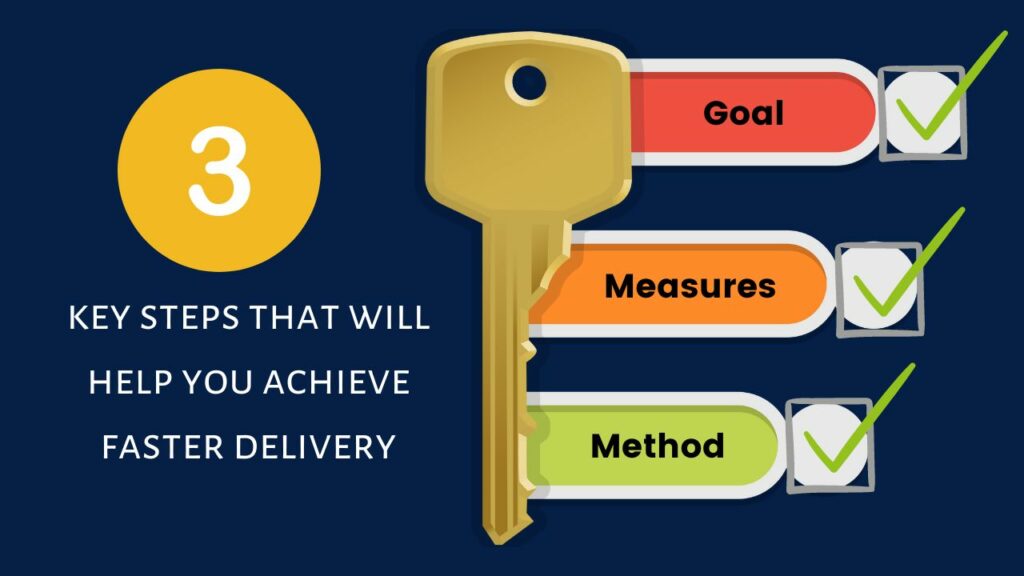
The following 3 key steps that will help you achieve faster delivery
- Goal
- Measures
- Method
Goal
This is a crucial first step to agree on a single goal. What is the one thing that you want to improve significantly?
You will want to add more than one goal because they are important too; the key here is to agree on ONE goal. In our experience, when you have three or more goals, the likelihood of achieving them is close to zero.
Focus on ONE thing and achieve it!
Goal: Deliver products faster to the market
What about value?
The product and features that we deliver are based on us first identifying the customer needs through research, market segmentation, and applying design thinking to create our feature and benefit hypothesis.
The products and features that we are building to the best of our knowledge are valuable. We will only know if we are correct in this hypothesis after delivering the feature(s), and our customers validate this assumption. We achieve product and market fit.
To validate our hypothesis and learn faster from the market, we need the organisational ability to deliver software products faster. Delivering software products faster is the focus of this post.
Most organisations are suffering from slow software product delivery. In this post, we use Faster software product delivery as our goal. We need to sharpen this goal a little bit, and we will do that later.
Measures
Once you have agreed on your goal, define the measures that inform us on how we are achieving the goal.
Outcome – Our goal may require months to achieve. We want a shorter-term outcome that will help us test our hypothesis faster. MVP Epic, in Scaled Agile Framework®, SAFe®, we define the Epic MVP as the smallest unit that will enable us to test out the hypothesis.
Feature – Define the features that will help us achieve the MVP Epic.
Lagging Measures
The above are examples of lagging measures. They tell you what has happened, but they don’t provide you or your team with a way of acting to achieve the desired outcome.
When defining the measure, we need to choose a small set of balancing measures based on the outcomes we want and balancing leading measures that will lead to the lagging measures.
Define the leading measures
We believe these activities will lead to lagging measures and act as predictors of achieving the lagging measures.
Leading measures
- Visualising the workflow and the work
- Work in progress
- Test-driven and behaviour-driven development
The work in progress is a leading indicator of how long it takes to complete a feature. The more items we have in progress, the fewer we will finish and the longer it takes to finish one.
This measure tells us how to act differently, increase the focus by working on one feature at a time, deliver it and start the next one.
Test-driven development and behaviour driven development are both practices that will increase code quality and require the team to act differently and are another leading measure they will leave to better design of software, higher quality and courage to make changes.
Method
Defining the goal and measures is not enough; we need to agree on the context’s method.
Sharpening the goal
Earlier I noted that the goal of Faster software product delivery needs to be sharpened later.
After we know our current capability and have spent a little time to understand our system of work, we can adjust our goal as:
Faster software product delivery, reduce 80th percentile of the time
it take to deliver a feature by 20% in six months.
For our case study example, this means reducing the 80th percentile from 43 days down to 34.
Aren’t targets a bad thing?
The reality is that clarity on the goal drives action. We need a clear goal that we can all commit to and see how our actions lead to achieving our goal. The goal needs to be realistic. This is why we set the goal after studying the system capability, so although ambitious, it is achievable.
Organise
How we are organised has a great impact on our ability to deliver software products. Most organisations are functionally designed. We want our product delivery to be organised around value delivered and not functional silos.
To meet the customer needs with minimal delays and handoffs. Visualising the workflow and the handoffs and loopbacks is a great way to see how we can improve the current way the team is organised.
Built-in accountability
Build a regular weekly cadence with the team to review the visual management system and for the team members to answer,
- Did I do my best in the past week to achieve my last week’s commitment?
- What was the impact on the visual management system?
- What is the one thing I am going to do this week that will have the most significant impact on moving us forward in achieving our goal?
Built-in collaboration
We make commitments to each other and hold each other accountable by building a highly collaborative environment aligned to a common goal.
How should we visualise the measures?
The measures need to be accessible to everyone and show how we are doing at a glance. Measures variation over time as an information radiator to help people understand the work system and improve how they work.
Leaders need to study the system and act on the system and improve the system of work.
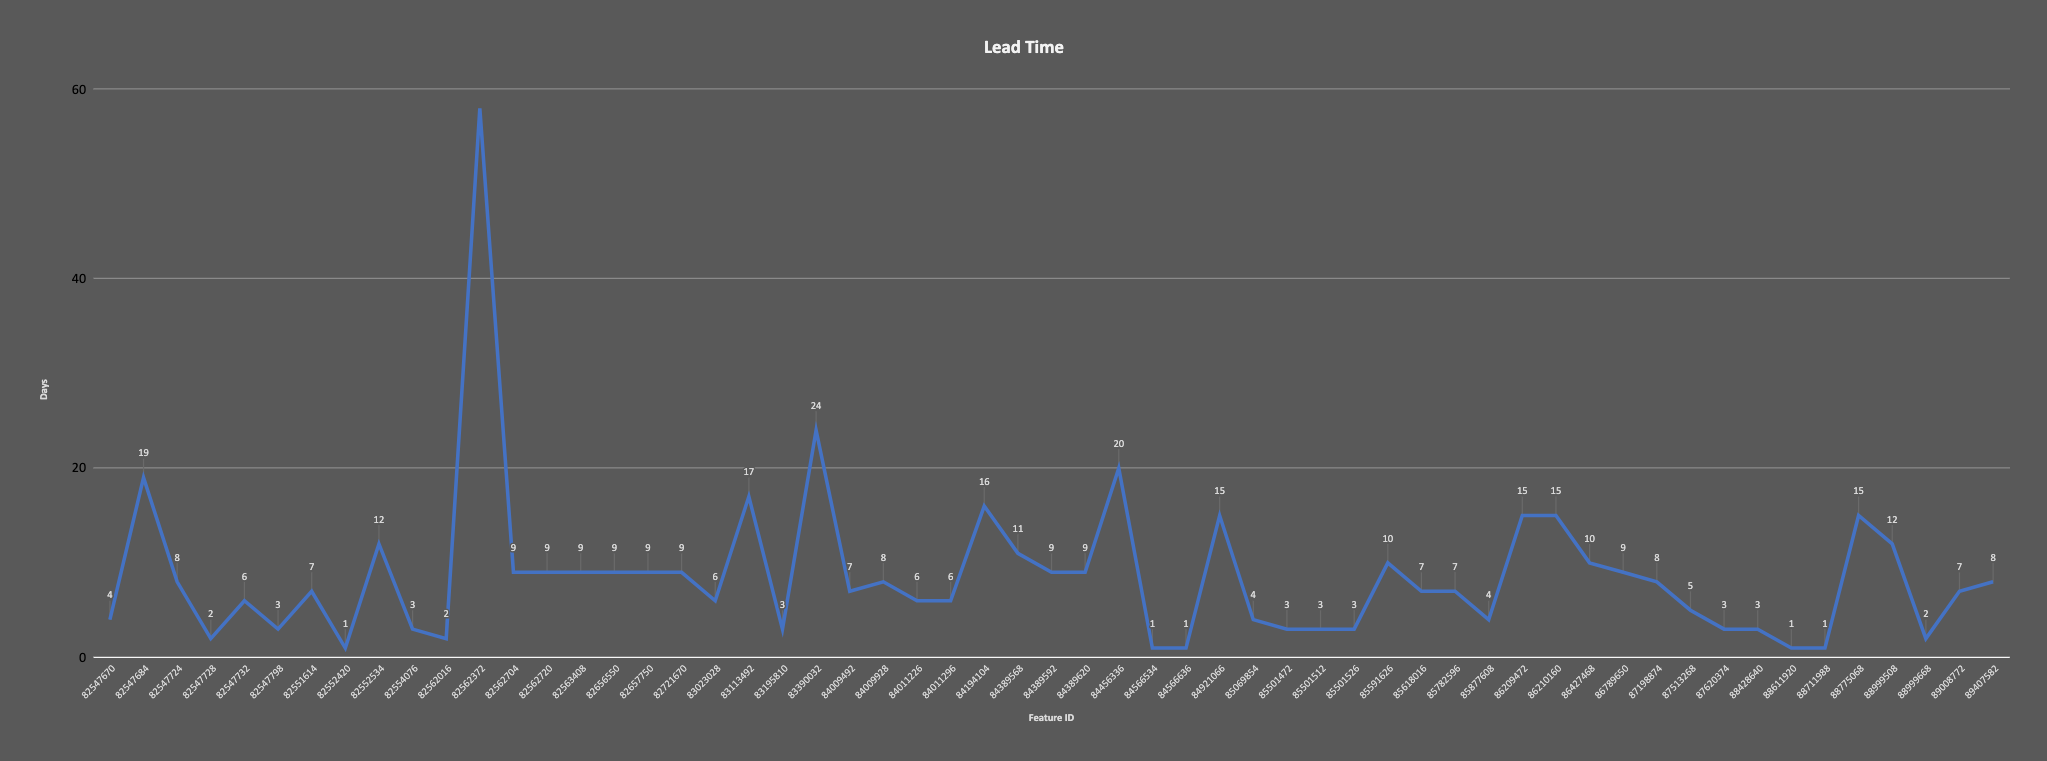
Visualising the measures is very important; a single number will not show the variation over time. Without understanding variation, this will likely lead to poor results.
Example of using a single number which hides the variation
The average Start Finish time is 10.42 days.
Can you easily see the variation in table format?
| ID | Title | Created At | Accepted At | Started At | Start2Finish |
| 82547670 | Change email confirmation | 23/9/2014 | 13/1/2015 | 8/1/2015 | 4.00 |
| 82547684 | Application Behaviour when | 13/10/2014 | 9/1/2015 | 16/12/2014 | 19.00 |
| 82547724 | Relevant people are lost if | 21/8/2014 | 11/12/2014 | 2/12/2014 | 8.00 |
| 82547728 | registration complete email | 6/6/2014 | 5/12/2014 | 4/12/2014 | 2.00 |
| 82547732 | User enumeration in | 14/10/2014 | 13/1/2015 | 6/1/2015 | 6.00 |
| 82547798 | signed in as | 16/10/2014 | 12/1/2015 | 8/1/2015 | 3.00 |
| 82551614 | Session warning appears | 12/11/2014 | 2/3/2015 | 20/2/2015 | 7.00 |
| 82552420 | Login errors and follow | 12/11/2014 | 12/1/2015 | 12/1/2015 | 1.00 |
| 82552534 | Redirect feedback | 12/11/2014 | 20/2/2015 | 5/2/2015 | 12.00 |
| 82554076 | Password validation | 12/11/2014 | 9/2/2015 | 5/2/2015 | 3.00 |
| 82562016 | Agree on approach on | 12/11/2014 | 24/11/2014 | 21/11/2014 | 2.00 |
| 82562372 | Carry Out Performance | 12/11/2014 | 4/2/2015 | 15/11/2014 | 58.00 |
Tables are not easy to see variation over time. A chart showing start to finish times (Lead Times) easily shows the variation and helps us improve.
Keep a visual board that shows clearly how the team is working and how likely it is to achieve its goal.
Show the lead measure clearly, which shows the team how their activities will lead to achieving the goal.
Visualise the flow of work and show the work and where it is at in its flow
Measure your current capability in terms of the lag measures and visualise this
Measure your current capability in terms of the leading measures and visualise them
Show the impact of the lead measure on the lagging measure.
Conclusion
To accelerate your software delivery, agree on one crucial goal, make this goal known and visible to everyone.
Acknowledge that software development is not deterministic, and you need to think and act differently.
Define the leading and lagging measures that inform us on how we are achieving the goal.
Build a visual management system that shows the leading and lagging measures, visualised work, and workflow.
A weekly accountability cadence for team members to commit to each other and hold each other accountable on the commitment.
Consider working in cells to accelerate software delivery further, although initially, things may feel slower because we are focused on finishing the work rather than starting.
And when we are blocked, we stop and fix what is blocking us rather than letting this work item age and start a new work item.
Here are the results of applying the above pattern with one of the teams.
References:
1) Freedom from Command and Control: A Better Way to Make the Work Work Paperback – 1 Oct. 2003. by John Seddon
2) 4 Disciplines of Execution: Getting Strategy Done Paperback – 21 July 2015 by Sean Covey (Author)
3) Kanban: Successful Evolutionary Change for Your Technology Business by David J. Anderson and Donald G Reinertsen